Alumni Demographics
The demographic information about living alumni was drawn between January 1–February 5, 2024. Alumni includes all degree holders and those who earned at least one year of credits in a degree-granting program. The UO has 269,005 living alumni
 In 153 countries
Top 15 U.S. States
Oregon 124,170California 37,228
Washington 19,750
Colorado 4,362
Arizona 3,942
Texas 3,890
Idaho 2,794
New York 2,580
Hawaii 2,525
Florida 2,205
Nevada 2,194
Illinois 1,846
Virginia 1,581
Alaska 1,558
Massachusetts 1,460
Top 15 Non-U.S. Areas
China 2,526Japan 2,416
Canada 2,108
Taiwan 1,131
Republic of Korea 996
Singapore 827
Indonesia 649
Germany 626
Hong Kong 571
Australia 446
United Kingdom 421
Thailand 410
France 333
Malaysia 322
Norway 280
Alumni by Gender
43.8%
Male12.5%
Unknown43.7%
Female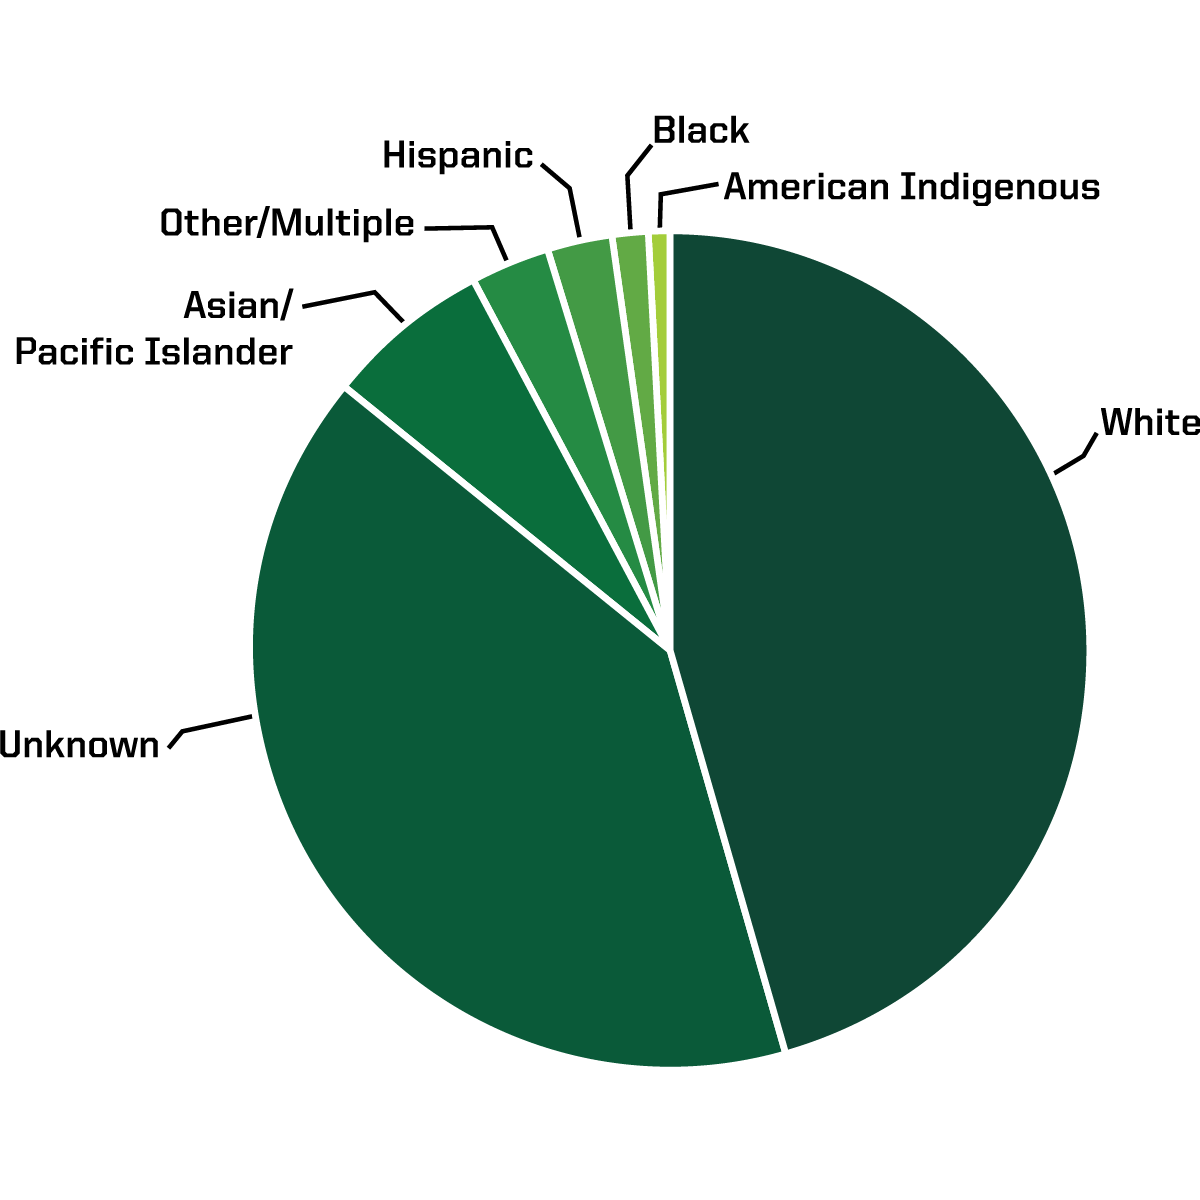
Alumni by Ethnicity
White/Non-Hispanic 122,540Unknown 107,864
Asian/Pacific Islander 17,466
Other/Multiple 7,965
Hispanic 7,028
Black/Non-Hispanic 3,592
American Indigenous 1,896
190,599 living degree holders

Alumni by School
College of Arts and Sciences: 106,004
Lundquist College of Business: 28,429
College of Design: 16,493
School of Journalism & Communication: 16,186
College of Education: 12,769
Lundquist College of Business: 28,429
College of Design: 16,493
School of Journalism & Communication: 16,186
College of Education: 12,769
School of Law: 7,807
Human Development and Performance: 6,221
School of Music and Dance: 3,072
Graduate School: 475
Other: 410
Human Development and Performance: 6,221
School of Music and Dance: 3,072
Graduate School: 475
Other: 410
Alumni by Graduation Decades

2020s 19,414
2010s 53,094
2000s 41,724
1990s 36,761
1980s 31,259
1970s 29,884
1960s and earlier 23,349
Unknown 200
2010s 53,094
2000s 41,724
1990s 36,761
1980s 31,259
1970s 29,884
1960s and earlier 23,349
Unknown 200
Download a Word Doc version